Visualizing Climate Connectivity for Government Policies & Land Use management.

Why
Climate decision-makers in Washington & British Columbia needed reliable, updated, & accessible climate data to guide government policies on habitat connectivity, wildlife management, & climate adaptation. However, they often struggled with outdated datasets, inconsistent formats, access barriers, & coarse-resolution maps spread across multiple platforms—making planning especially difficult for government bodies & land managers, including those from First Nations & Tribal communities. My research focused on uncovering user needs, validating proposed TerrAdapt features, & identifying the biggest challenges users face when working with climate data—while remaining mindful of the cultural contexts of the end users.
How
I conducted a survey (N=41) across diverse user groups:
- Government agencies (U.S. & Canada)
- Non-profits
- Leaders of First Nations & Tribes
- Consultants, wildlife biologists, hydrologists, & municipal staff
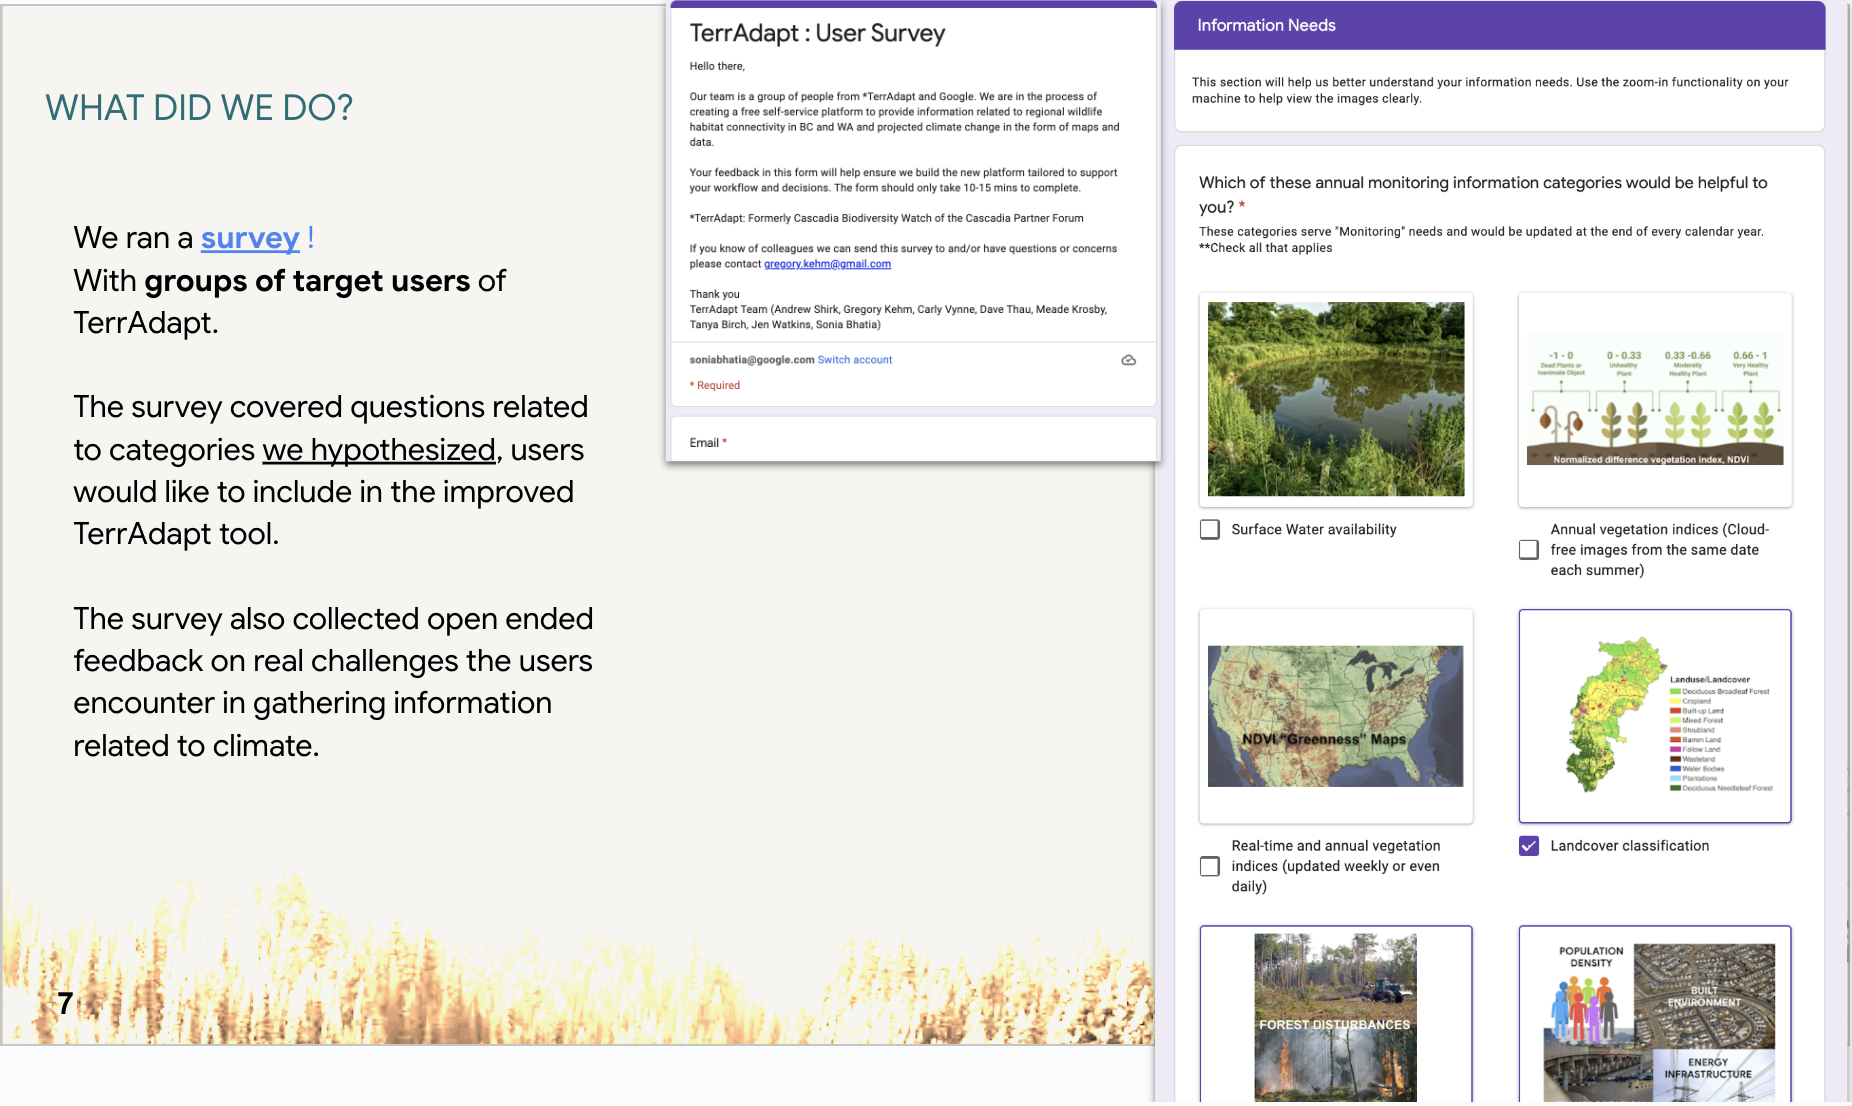
Visual Surveys to Bridge Cultural & Regional Differences
Realizing that many concepts, habitats, & species were referred to differently across cultures & regions, I designed the survey using pictures instead of names or terms that might vary locally. This visual approach helped overcome confusion, enabling end users to engage meaningfully with the Survey. It also unblocked organizations that had previously struggled to run surveys, as end users often found text-heavy or terminology-based surveys difficult to understand.
The survey gathered:
- Prioritized climate information categories.
- Feedback on data access & usability challenges.
- Desired features for the TerrAdapt tool.
I later conducted 1:1 user interviews to dive deeper into workflows, gather reactions to the MVP, & capture recommendations for refining the tool’s design.
Findings
- Most Useful Data: Annual monitoring, vegetation disturbance, habitat connectivity, land cover classification, & habitat suitability ranked highest.
- Additional Needs: Users requested climate projections, spatial prioritization, & automated alerts for habitat changes.
- Challenges: Outdated data, missing layers, inconsistent formats, & access restrictions were recurring pain points—especially among First Nations & non-profits.
User Quotes:
“Data is generally not updated as regularly as needed for guiding projects & land use proposals.” — Government respondent
“Lots of mapping & modelling excludes provincial parks & protected areas.” — Provincial government respondent
“Information is out there, but not organized in an accessible way.” — Tribal respondent
Impact
My research directly informed TerrAdapt’s MVP design & prioritization. As a result:
- Features Added: Spatial data downloads, annual monitoring, dashboard summaries, & alerts for habitat changes.
- Policy Alignment: Supported climate adaptation, wildlife habitat, & land-use connectivity policies across the region.
- Accessibility Improvements: Highlighted the importance of reliable internet access for First Nations & remote users, ensuring inclusivity in design decisions.
- Launched Product: In 2021, TerrAdapt Cascadia launched as a tool to visualize dynamic landscape connectivity in real-time, shaped by research insights.
Here is the Link to the fully launched website. I am continuing to work with the organization on the new and improved version 2 of this website.