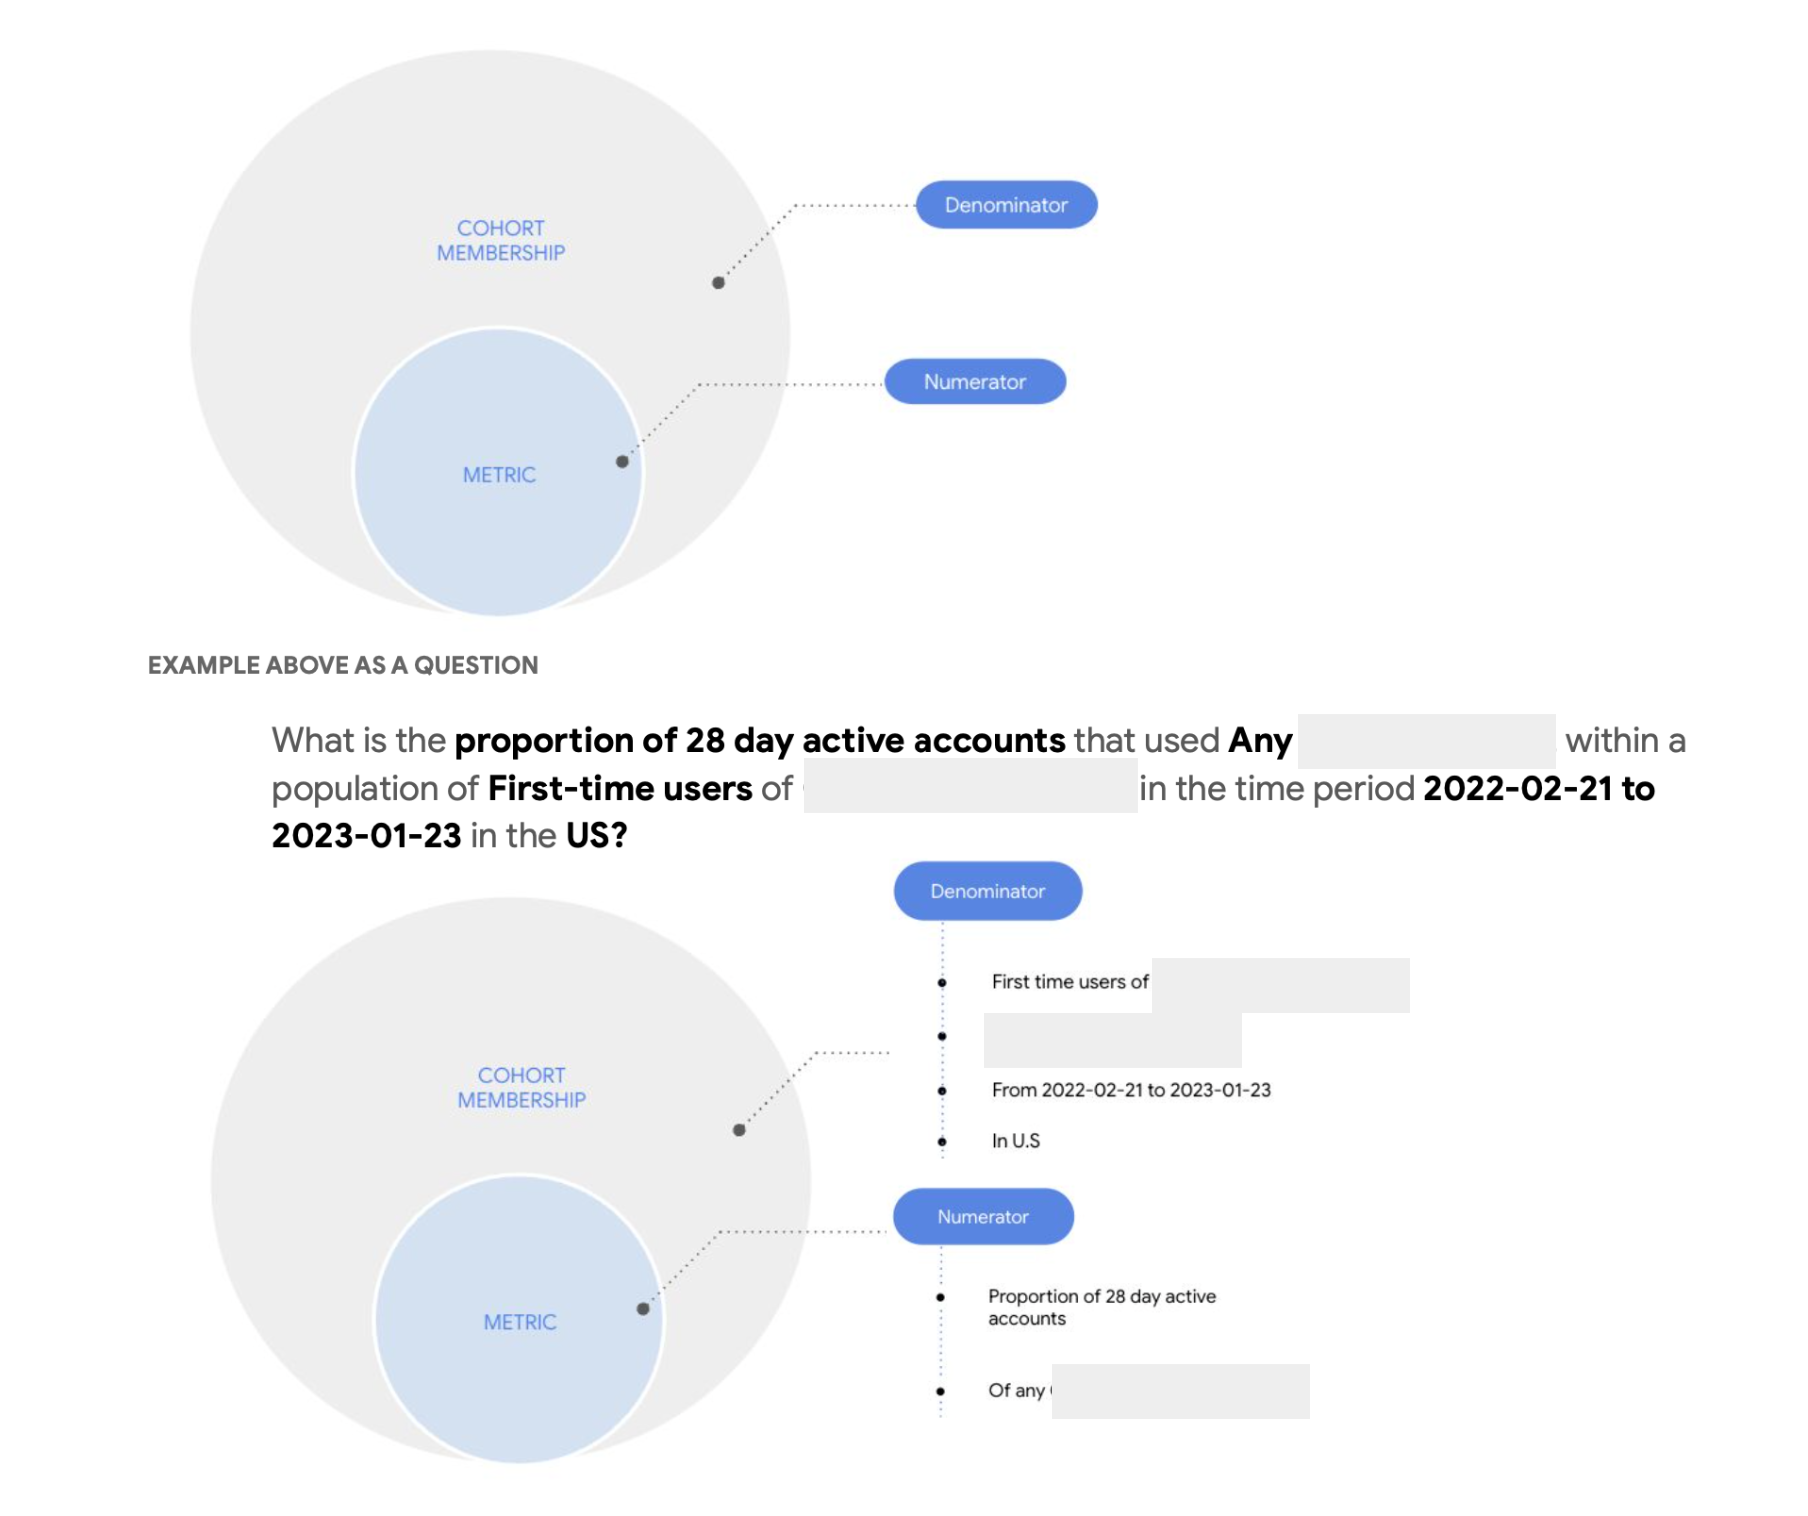
Enhancing Adoption of a No-Code Cohort Analysis Tool

Why
The Google data analytics team hypothesized that a No-code, GUI-based Cohort Analysis tool could empower non data-savvy employees to explore hypotheses independently. The goal was to reduce reliance on analysts for ad-hoc exploratory requests by providing a fast, visually intuitive tool. The research set out to understand:
- How widely the tool would be used by non data-savvy users.
- Usability challenges in the MVP version.
- Opportunities to refine the tool for broader adoption and impact.
How
The study combined exploratory research with usability testing across both data-savvy and non data-savvy participants:
- Usage Context – Explored when and where cohort analysis factored into decision-making.
- User Intent & Case Studies – Identified common questions and expectations behind cohort analysis.
- MVP Usability Testing – Tested the first version of the tool with 20 participants to uncover strengths and improvement areas.
Impact
- Positive Early Feedback: Participants valued the tool’s speed and visual design.
- Key Limitations Identified: Users highlighted gaps in flexibility, data filtering, and handling larger datasets.
- Next Iteration Improvements: Introduced drill-down capabilities, simplified filtering, and large dataset support.
- Adoption & Value: Following improvements, the tool achieved a 75% adoption rate within the initial launch group. Post-launch feedback (30 days in) confirmed that non data-savvy users found the tool especially valuable for validating or debunking market hypotheses independently, reducing dependence on analysts.
